Posted by Tom
Salon and Team Dashboards + KPIs on SalonIQ
In today’s webinar we touched on Team and Salon dashboards as well as KPIs – these are all key areas of your business and give you vital information. So looking at them often is a must! Knowing and understanding the direction your business is going in is key to a successful salon and continuous growth. SalonIQ have the best tool to ensure you keep track revenue, stylist targets, salon forecast and much more.
SalonIQ software have 2 dashboards, Team Dashboard and Salon Dashboard Both dashboards are great for independent salon or group salons that like to compare certain areas of their business all on one page. Let’s start with the Salon Dashboard on SalonIQ software As always with a lot of areas on salon IQ you can personalise and apply specific filters which allows you to view only the information you are interested in, by clicking the cog on the top right hand side of the dashboard screen. Below you can see a snap shot of the averages for the week for 1 particular salon; 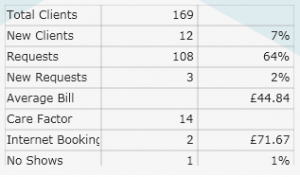 You can view these figures for any date range, whether that be for the day, week, month, year or a customised date. This chart is also viewable on the team dashboard. So no more calculating figures to find your averages.
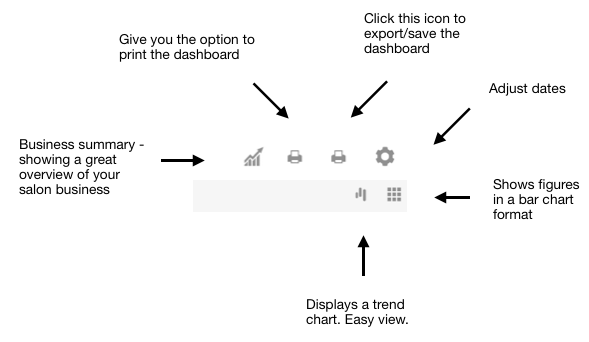
 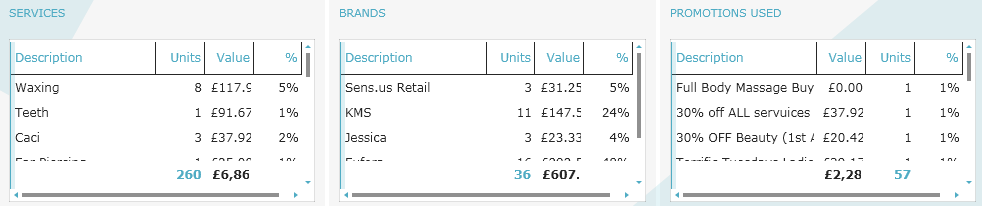 I don’t know about you, but I am always limited on time but still like to keep a close eye on the business including the number of promotions that the salon is doing, along with retail that is sold and what services are most popular for the dates I have selected. You can see looking at the image above we have 3 boxes ‘Services’, ‘Brands’, and ‘Promotions Used’, each category I really could not live without. It shows the Description, Units, Value and % across each category. Again all this information can be viewed for the day, week, month or a customised date. The image below shows 6 symbols which you will see on the top right hand corner of the dashboards screen.
  Team dashboard displays very similar information to the Salon dashboard, however you can see each individual employee. The stats are great on the dashboard to make comparisons with other employees. By clicking on the category at the top you can see a hierarchy, I love this feature as you can clearly see who is performing in your salon for services and retail. Again you can view all this information with any date you select. Anther key feature is enabling your employees to view their own dashboards without seeing anyone else’s. As James explained in the webinar, deeding on what user roles you have set, you can make sure that the team members can only see their dashboards and no-one else’s. We have found in the salons that the employee actually become quite addicted to see how they are doing and heck them everyday. View GDPR Webinar here
Call a member of our team today on 01892 280 123